
A Lambda function times out, a DynamoDB alarm fires, IAM looks fine, and the real fault is a one-line security group change in a Terraform stack that another team owns. That is the everyday shape of Terraform troubleshooting across multiple state files, and it is exactly the kind of incident that burns hours of cross-team log-diving.
Splitting infrastructure into independent stacks, each with its own state file, is good Terraform practice. It limits blast radius, speeds up plans and lets teams own their own code. The price is visibility: a failure can surface in one stack while its cause sits in another, and no single terraform plan shows both.
This guide explains why multi-state failures are so hard to debug, then walks through a complete worked example using AWS DevOps Agent, AWS's always-on AI operations teammate. The example follows the scenario in the official AWS DevOps blog post: three Terraform stacks, one subtle networking change and a root cause found across the state boundary.
Key takeaways
- State boundaries isolate changes, but they also hide cause and effect. Symptoms appear downstream, causes sit upstream.
- AWS DevOps Agent reasons over AWS resources and their relationships, not Terraform stacks, so it follows a failure across state files without being told where to look.
- In the worked example, the agent correlated two alarms into one event, dismissed a misleading DynamoDB signal and tied the failure to a CloudTrail security group change.
- The agent produces a mitigation spec that hands off to Kiro, which writes the Terraform fix. A human still reviews the diff, plan and apply.
- Diagnosis quality depends on your signals. Enable VPC Flow Logs, CloudTrail and sensible alarms before you need them.
Why multiple Terraform state files make troubleshooting hard
Multi-state setups fail in a distinctive way: the team that sees the symptom is rarely the team that owns the cause. Five properties of the pattern drive that.
- Ownership splits along stack lines. A networking team owns the VPC and security groups. An application team owns the Lambda and the API. When the app breaks, the app team starts at the app.
- Stacks share only outputs. A stack that reads another through
terraform_remote_statesees published outputs, not the other stack's resources, rules or recent changes. - Symptoms travel downstream. A blocked network path shows up as Lambda timeouts and, further along, as a database metric that merely looks unhealthy.
- Plans are single-state.
terraform plancompares one state to one configuration. It cannot tell you that a sibling stack changed something your resources depend on. - Audit trails point at automation. CloudTrail records
terraform applychanges under the CI/CD role, not the engineer who wrote the pull request.
The usual manual response is a slow sweep: check logs, rule out IAM, check the database, then eventually ask the other team what changed. A typical first pass looks like this:
# Inspect what each stack believes it manages
terraform state list
terraform output

# Detect drift without proposing changes
terraform plan -refresh-only

# Turn on verbose provider logging for one run
TF_LOG=DEBUG terraform plan
These commands are essential for single-stack problems and for state hygiene. They do not answer the cross-stack question: what changed in the infrastructure my workload depends on, and when? That question needs a view across resources, metrics, logs and change history at once.
What AWS DevOps Agent is and how it investigates
AWS DevOps Agent is a managed, always-on operations agent that behaves like an experienced engineer on call. AWS launched it in preview on December 2, 2025 at re:Invent and made it generally available on March 31, 2026. At GA it added support for investigating applications in Azure and on-prem environments, plus enterprise features such as custom agents.
Three ideas matter for Terraform troubleshooting:
- Agent Space. The workspace where you connect accounts, data sources and alert channels. An Agent Space in one supported Region can investigate resources in accounts and Regions elsewhere.
- Topology discovery. The agent builds a map of resources and the relationships between them. Because it models resources rather than Terraform stacks, state-file boundaries do not stop it.
- Parallel investigation. When an alert arrives, the agent runs several lines of inquiry at once: metrics, logs, CloudTrail change history and network configuration. It then reports a correlated root cause with evidence.
In short, it automates the sweep that a human would otherwise run by hand across teams. For readers evaluating the service, the pricing model is covered in the limits and pricing section below.
Reference architecture: three state files, one agent
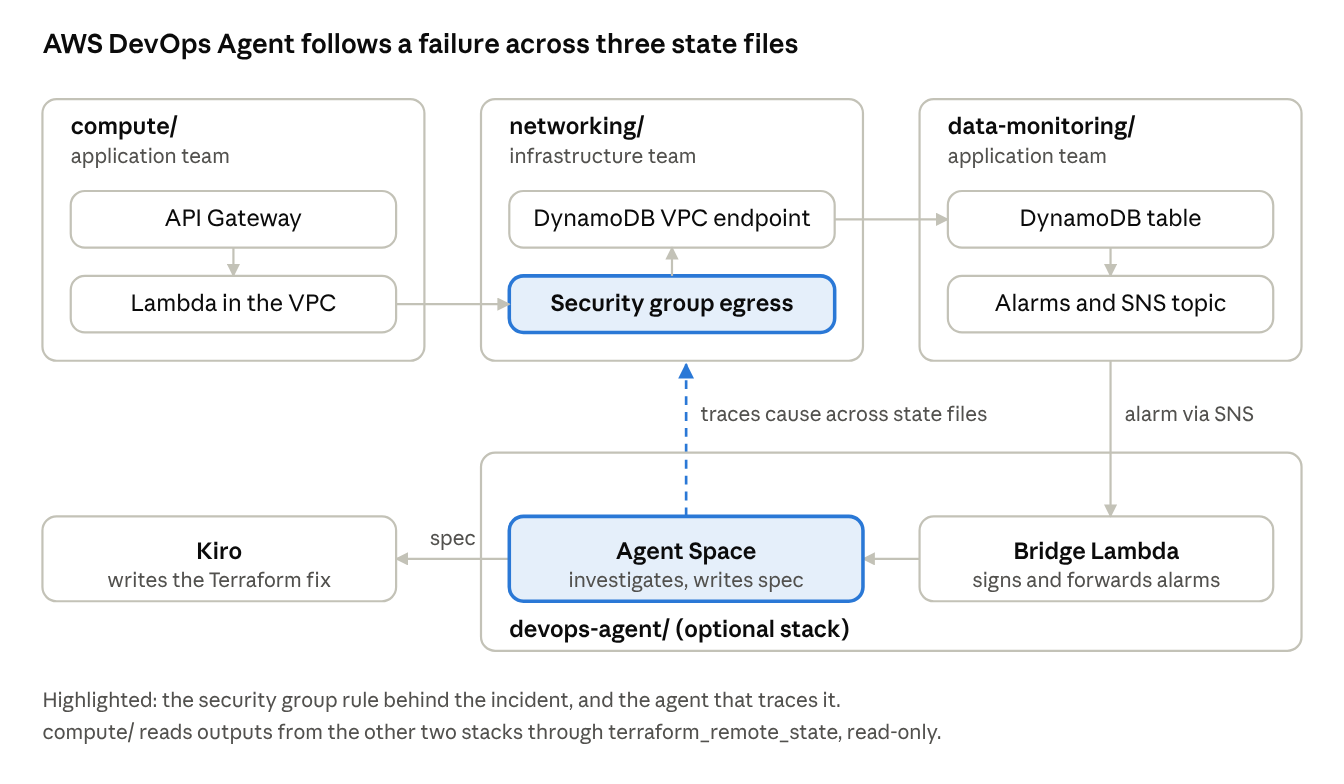
reference architecture · 3 state files plus an agent stack
The AWS example is a small serverless application split into three independent Terraform stacks, each with its own state file, plus an optional stack that wires up the agent. A request flows from API Gateway to a VPC-attached Lambda function, through a security group and a DynamoDB gateway endpoint, and on to the table. The alarms leave through SNS to the agent.
- networking/ (infrastructure team): the VPC, private subnets, the Lambda security group, the DynamoDB gateway endpoint and VPC Flow Logs.
- compute/ (application team): the Lambda function and an HTTP API. It reads outputs from the other two stacks through
terraform_remote_stateand never writes to them. - data-monitoring/ (application team): the DynamoDB table, an SNS topic and two CloudWatch alarms.
- devops-agent/: the Agent Space, its IAM trust role and a webhook bridge Lambda.
There is no NAT gateway. The only path from Lambda to DynamoDB is TCP 443 to the DynamoDB prefix list, allowed by a single egress rule in the networking stack. That one rule is the single point of failure the example exploits.
Setting up AWS DevOps Agent with Terraform
DevOps Agent resources are not in the standard hashicorp/aws provider. You create the Agent Space and the account association through the hashicorp/awscc provider, which wraps the AWS Cloud Control API. The reference example needs these versions:
terraform {
  required_version = ">= 1.6.0"
  required_providers {
    aws   = { source = "hashicorp/aws",   version = ">= 5.50.0" }
    awscc = { source = "hashicorp/awscc", version = ">= 1.66.0" }
  }
}
The setup follows seven steps:
- Create the Agent Space with the
awsccprovider. - Write the trust policy for the
aidevops.amazonaws.comservice principal, and scopeaws:SourceArnto the exact Agent Space ARN. - Attach permissions: the managed policy
AIDevOpsAgentAccessPolicy, plus an inline policy that allowsiam:CreateServiceLinkedRolefor AWS Resource Explorer, which the agent creates on first run. - Associate the account in
monitormode using that role. - Deploy a bridge Lambda. CloudWatch cannot call the agent directly, so a small function subscribes to the alarm SNS topic and forwards each alarm as a signed webhook event.
- Generate the webhook in the console (Capabilities, then Webhook, with HMAC authentication). Terraform does not manage this step, so copy the URL and secret into the SSM Parameter Store placeholders that Terraform created.
- Wait for discovery. Treat it as finished when the relationship count stops growing and the association shows Active. In a new account of this size, that took roughly 10 to 15 minutes.
Deploy the application stacks in dependency order: networking, then data-monitoring, then compute, then the agent stack. Destroy them in the reverse order.
Gotchas worth knowing before you start
| Symptom | Cause | Fix |
|---|---|---|
| HTTP 400 when the agent assumes its role | Wildcard in aws:SourceArn |
Use the exact Agent Space ARN |
| "Invalid STS role configuration" on first apply | IAM propagation race | Re-run terraform apply |
| HTTP 403 from the webhook | Signature format is off | Sign timestamp:payload with HMAC-SHA256, Base64-encode, send both headers |
| Webhook step skipped | Webhook creation is console-only, outside Terraform | Paste the console-generated values into Parameter Store |
The cross-stack failure and its misleading symptoms
The injected fault is deliberately ordinary. A single boolean variable, restrict_egress, switches the Lambda security group's egress rule between two modes:
false(healthy): allow TCP 443 to the DynamoDB gateway endpoint's prefix list.true(broken): allow TCP 443 only to the VPC CIDR, which silently blocks DynamoDB traffic.
In the example the change is labelled as a security-audit hardening step, so it reads like routine tightening in a pull request and passes review easily.
After the apply, API Gateway still accepts requests and Lambda still starts. Every DynamoDB call then hangs until the 30-second function timeout. Four signals send a human investigation the wrong way:
- Lambda logs show a plain timeout, with no stack trace and no
AccessDenied. - The DynamoDB table looks healthy.
- IAM permissions are correct.
- A DynamoDB read-capacity alarm fires, pointing straight at the database. It is a red herring: capacity falls only because requests never arrive.
The real cause lives in the networking stack, owned by a different team, with a different state file. This is the visibility gap that state boundaries create, in one concrete incident.
Root cause analysis: how the agent finds the fault
When both alarms fire, the bridge Lambda forwards them and DevOps Agent opens one investigation. It runs parallel lines of inquiry across Lambda metrics, DynamoDB metrics, Lambda logs, CloudTrail and VPC networking, then reports a single correlated conclusion.
| Signal | What a human sees first | What the agent concludes |
|---|---|---|
| Two alarms | Two unrelated incidents | One related event |
| Dependency path | A Lambda and a database | API Gateway, Lambda, VPC, security group, DynamoDB endpoint, DynamoDB, mapped as one chain |
| Lambda logs | A vague timeout | Connection timeouts to the endpoint, not a permission or database error |
| CloudTrail | Nothing obvious | A security group egress change, with timestamp and principal, about a minute before the timeouts |
| DynamoDB capacity drop | The database is struggling | A downstream effect of blocked requests |
The stated root cause: a security group egress change replaced the prefix-list rule with a VPC-CIDR-only rule, so Lambda in private subnets could no longer reach DynamoDB through the gateway endpoint. The table was healthy throughout. With VPC Flow Logs enabled, the agent also had network-layer evidence that traffic was dropped before it reached the table.
Two details explain why this works across state files. The agent models resources and relationships, so a stack boundary is invisible to it. And it uses change history, so the investigation ends on a specific event, not a list of suspects.
From diagnosis to fix: the mitigation spec and Kiro
The agent does not stop at the diagnosis. Its Mitigation plan tab includes a Copy spec button that exports a plain-language specification for Kiro, AWS's agentic development tool. The spec states intent, not syntax:
- Goal: restore Lambda's path to DynamoDB through the VPC endpoint.
- Target: the Lambda security group in the networking stack.
- Rule: egress, TCP, port 443.
- Destination: the DynamoDB endpoint's prefix list.
Kiro reads the networking code, finds the rule and writes the Terraform change. In a toggle-based repo that means setting restrict_egress back to false. In a repo with a direct rule, it swaps the cidr_blocks destination for the DynamoDB prefix_list_ids.
The human stays in control of the change:
- Review the generated diff.
- Run
terraform planand confirm that only the egress rule changes. - Run
terraform apply.
Validation. The request that timed out now returns immediately. Consumed read capacity rises again, so the DynamoDB alarm returns to OK. The Lambda error-rate alarm clears as timeouts stop, and the bridge forwards those OK transitions so the agent reflects the resolution.
Limits, best practices and pricing
The agent is strong at cross-stack correlation, but it has limits you should plan around.
Known limits
- It reasons about AWS resources, not Terraform stacks. You still map the security group back to the stack and repo that own it.
- CloudTrail attributes
terraform applychanges to the automation role, not the engineer behind the pull request. - Diagnosis quality tracks your signals. Without VPC Flow Logs, the network-layer evidence is weaker.
Practical steps for Terraform teams
- Turn on CloudTrail, VPC Flow Logs and symptom-level alarms (error rate, latency) before an incident, not during one.
- Give your CI/CD role a distinct session name per pipeline run so CloudTrail entries trace back to a build and a commit.
- Tag resources with the stack, repository and owning team, so a resource found in an investigation leads to its owner in seconds.
- Describe the intent of security changes in pull requests, since "hardening" with no impact note is how an egress rule slips through review.
- Keep the agent stack in Terraform too, and treat the webhook secret like any other credential.
Pricing in brief. AWS bills DevOps Agent for the time it actively works, per second. The AWS pricing page lists $0.0083 per agent-second for investigations, evaluations and on-demand SRE tasks, which is about $29.88 per hour of active agent time, with no idle cost. Eligible AWS Support plans also receive monthly DevOps Agent credits, as covered in the AWS Support announcement. Confirm current rates, free-trial terms and Regions on the pricing page before you budget.
How Metasips helps teams with multi-state Terraform and AWS operations
As an AWS Advanced Consulting Partner, Metasips helps engineering teams make this kind of incident rare and short. Typical starting points:
- Operate it for you. Our managed DevOps services cover pipelines, Terraform state strategy and on-call readiness, so cross-stack failures land with a team that already knows your estate.
- Own the platform long term. AWS infrastructure management keeps networking, compute and data layers consistent, monitored and documented.
- Harden without breaking things. Our security and compliance work reviews changes like the egress tightening above for blast radius before they ship.
- Keep spend sensible. Our cost optimization service helps you size observability and automation, including per-second agent usage, against the value they return.
See how we work in our case studies, or talk to the Metasips team about untangling your Terraform state layout.
Frequently asked questions
How do you troubleshoot a failure that spans multiple Terraform state files?
Start from the symptom's dependency path, not from one stack. List what the failing workload depends on, check recent changes to each dependency in CloudTrail, then map the offending resource back to its stack and owner. AWS DevOps Agent automates that sweep.
Does AWS DevOps Agent read my Terraform state?
No. In the AWS example it reasons about live AWS resources, their relationships, metrics, logs and CloudTrail history. That is why state boundaries do not limit it, and why you must map findings back to the owning stack yourself.
Can I create an Agent Space with Terraform?
Yes, through the hashicorp/awscc provider, since DevOps Agent resources are not in hashicorp/aws. The webhook that receives alarms is generated in the console.
Does the agent fix the problem automatically?
No. It produces a mitigation spec. Kiro turns that into a Terraform change, and an engineer reviews the diff, the plan and the apply.
What does AWS DevOps Agent cost?
It is billed per second of active agent time, at $0.0083 per agent-second on the AWS pricing page, with no idle charge. Check the page for current terms.
Which Regions support it?
The AWS post states 11 Regions, and an Agent Space in a supported Region can investigate resources in accounts and Regions elsewhere. Check the Regions list, because availability has been expanding.
Sources
- Tracing failures across Terraform state boundaries with AWS DevOps Agent, AWS DevOps & Developer Productivity Blog
- AWS DevOps Agent is now generally available, AWS What's New, March 31, 2026
- AWS DevOps Agent pricing, AWS
- Accelerate incident resolution with AWS DevOps Agent, now included with AWS Support plans, AWS re:Post